How to Measure Customer Experience: 8 Metrics to Use

Introduction

Customer experience, or CX, is the first impression that a business leaves on its patrons, shaping their perception of it and ultimately fostering brand loyalty. If there’s one thing I know about CX, it’s that using metrics to measure it can help increase customer retention.

75% of consumers will purchase more for products from companies that offer them a positive experience, according to the Zendesk Customer Experience Trends Report. Consequently, more than 60% of CX managers state that their organization now places a higher priority on customer experience than it did a year ago.

Measuring customer experience and pinpointing opportunities for improvement is more crucial than ever in light of the increased focus on CX. Learn which CX metrics offer the greatest insight and how to use that information to continuously improve the customer experience to position yourself for success.

What is customer experience?

Customer experience (CX) refers to the journey of a customer’s or prospective customer’s interactions with a firm.

I find it useful to consider that a customer’s experience begins the moment they learn about my company and proceed through the purchasing process. Furthermore, CX encompasses the weeks, months, or even years that pass after a consumer utilizes my service or product.

Whatever kind of business you own, you most likely put a lot of effort into attracting customers and convincing them to buy from you. However, it’s also critical to consider the big picture. That can entail offering assistance to your clients years from now.

Why is this extra effort and money worth it to the business? Gaining new customers is more expensive than keeping current ones, and 65% of consumers claim they would stop doing business with a company after a negative encounter.

Measuring Customer Experience

Customer experience is best thought of as a puzzle. Customer support is but one component of the whole. You want customers to respond favorably to your marketing and advertising campaigns. It should be simple for them to use your goods or services. Additionally, your staff ought to respond to them right away. All these components work together to create a satisfying experience for your customers.

There are two main approaches to CX evaluation:

After a customer interacts with your business, ask them directly about their experience by sending them questionnaires or survey.

Monitor first-party customer support data to gain insight into the kind of customer experience (in terms of quality, speed, and efficiency) your team is offering.

When measuring customer experience, i recommend a combination of the two approaches. Customer service surveys allow your consumers to provide feedback on how well you’re doing, while KPIs for customer service help you define performance targets and goals.

You may monitor hundreds of distinct customer experience metrics, some of which are more crucial than others based on the kind of business you run. However,  it in experience the metrics below  are standard across all businesses.

1. Customer Satisfaction Score (CSAT)

Despite being primarily employed as a measure of customer service, CSAT can also provide insight into the customer experience, as support contacts constitute a significant portion of customer experience (CX). This is a short survey that asks about a customer’s level of satisfaction after dealing with your company.

Consumers typically assign ratings on a 0–5 or 0–10 scale. In any case, you acquire a percentage of satisfied consumers by multiplying your average score by 100. Because the scores range from 0 to 100, this makes them all comparable:

How to Calculate CSAT 

All you have to do is send out a survey right after a purchase or interaction to find out CSAT. On a similar scale, this survey will inquire about the customer’s level of satisfaction with their experience. The survey’s average score is known as the CSAT.
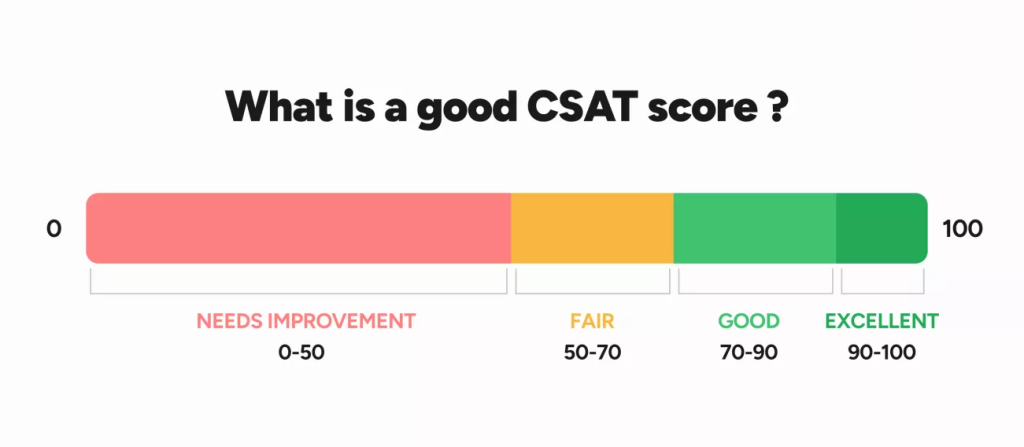
Source: Apizee

The percentage of clients that give you a low rating is represented by your DSAT (customer dissatisfaction) score. While low scores suggest some touchpoints need work, high scores reflect a positive physical and digital consumer experience.

2. Net Promoter Score (NPS)

One of the primary tools for assessing customer experience is the Net Promoter Score (NPS). The percentage of consumers that adore, tolerate, or detest your brand will be revealed to you by your net promoter score (NPS). I know it hurts to hear that some consumers don’t like your brand, but you need to know this information in order to make the necessary adjustments to enhance the customer experience.

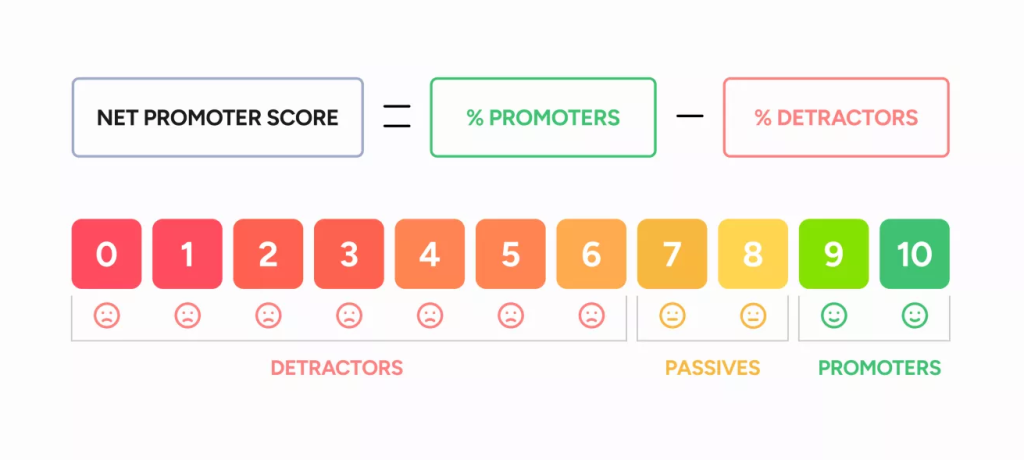
An NPS score splits your answers into three groups:

Promoters (who score between 9-10)

Passives (who score between 7-8)

Detractors (who score between 0-6)

Source: Apizee

How to Calculate NPS

On a scale of 0 to 10, you will ask your customers in a survey how likely they are to suggest your business to a friend in order to determine their net promoter score (NPS). Detractors receive scores 0–6, passives receive scores 7-8, while promoters receive scores 9–10.

The percentage of detractor responses deducted from promoter responses is your net promoter score (NPS).

3. Customer Effort Score (CES)

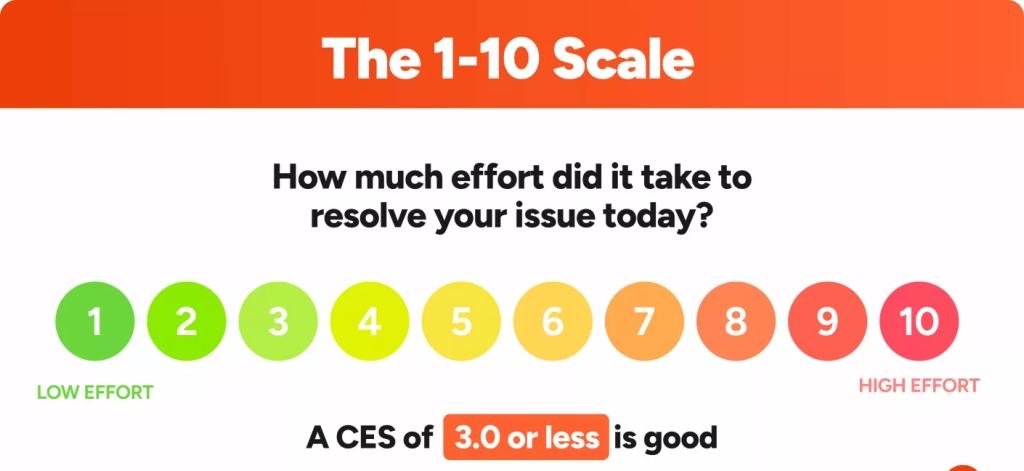
Your clients desire straightforward encounters, if they’re anything like mine. Navigating via your website should be simple. It should be simple to assemble and operate your products. And the consumer should find it simple to get in touch with your customer support representatives.

The Customer Effort Score (CES) gauges how well customers communicate with your customer support representatives or product. According to a study by Salesforce, 80% of consumers think that a company’s customer experience is just as significant as its goods or services. 

Source: Apizee

How to Calculate NPS

The total number of survey responses you received divided by the sum of your customer effort evaluations is how you compute customer experience points, or CES.

If users are rating a product as being difficult to use, you should come up with creative solutions to improve its usability. For example, if your website’s menu is difficult to find, you should rebuild it or use a simpler style to enhance the user experience.

4. customer’s lifetime value (CLV)

A customer’s lifetime value (CLV) indicates the total contribution customers have made to a company over the course of their relationship. Put  differently, their perceived value or worth to a company. The computation also accounts for the cost incurred by the company to retain that client.

It’s a useful measure of customer satisfaction since it allows you to track whether customers are spending less money with you or are more satisfied and making more purchases over time.

How to Calculate CLV

The customer value multiplied by the average customer lifespan yields the CLV.

Generally speaking, the CLV increases with improved CX. However, you can identify the reason and come up with ways to increase the CLV if you notice that the consumer is spending less over time.

5. Rate of Customer Churn

The percentage of your consumers or subscribers who cancel or choose not to renew their subscriptions within a specific time frame is known as your churn rate.

Preventing customer churn is a challenge for many businesses with as many as 20% of service providers. Even while turnover is unavoidable, it’s crucial to understand why it’s occurring in your business so you can minimize it.

How to Calculate churn rate.

You will need to keep track of the quantity of consumers over certain times in order to determine your churn rate. Next, apply this equation:

([beginning of the period customers] – [ending of the period customers]) ÷ (beginning of the period customers) × 100

Assume that you lost five of the 200 clients you had at the beginning of the month.

(200 – 195 customers from start to finish) ÷ 200 customers at the beginning of the month × 100 = Churn rate of 1.7%

6. Customers Retention Rate 

The churn rate and the customer retention rate are basically the two sides of a coin, and according to 31% of service industry professionals, boosting client retention is one of their top priorities. This CX metric calculates a company’s customer retention rate over a certain time period and is useful in assessing client loyalty.

Customer retention rate is the percentage of customers who stick with your company for an extended length of time. It displays how well your business is able to maintain happy, engaged, and devoted current clients through your CX.

However, because you have to account for the consumers you acquired, lost, and retained over a predetermined period of time, calculating retention rate is a little trickier.

How to Calculate the rate of retention:

([Number of customers at end of period – Number of new customers acquired during same period] ÷ Number of customers at start of period) × 100

Decide on the duration, which might be one week, one month, one year, etc.

Commence with the quantity of clients you have at the conclusion of that predetermined time frame.

Deduct the number of new clients you acquired within the allotted time.

The number that results is divided by the total number of clients you had at the start of the month.

To obtain a percentage, multiply the outcome by 100.

The goal should be to attract new clients who eventually turn into devoted ones, all while maintaining a high retention rate. If your sales are strong but your retention rate is low, you should find out why customers are coming in for one or two purchases and then walking away from your company.

7. Customer Journey Analytics

Analyzing the client journey with your analytics is another way to gauge the quality of the customer experience. In order to provide a better customer experience, 23% of service professionals have set out to better understand the customer journey.

You may get information about the needs, pain areas, and motivations of your customers from your customer journey map. Additionally, it will assist you in comprehending every interaction a customer has during their journey. And that’s how you’ll compile the metrics for your customer journey.

Analyzing  Customer Journey

You should definitely start gathering information from your website, social media accounts, advertisements, business events, product evaluations, onboarding, customer loyalty programs, emails, and surveys in order to examine the client journey. The metrics of your touch points can then be reported on a page or tab on your customer journey map, allowing you to assess the overall quality of your client experience.

8. Trends in Customer Support Ticketing

In 2023, 48% of service industry professionals reported receiving more customer service inquiries. To identify patterns affecting the customer experience, review your customer support tickets.

Are there any persistent problems that your clients are having trouble with? If so, make an effort to enhance them as they arise. Based on the tendencies you found, you can determine that you need to make product modifications, explanation videos, or clearer instructions.

Analyzing Ticket Trends for Customer Support

First response time, average handle time, and first call resolution are important customer support ticket metrics and trends to examine. From the standpoint of customer service, you can enhance the customer experience with the aid of these analytics.

Customer experience metrics best practices

CX metrics and KPIs provide you with numerical benchmarks to monitor development and advancement. To make sure you don’t misinterpret your data, you should adhere to these three best practices.

Analyze consumer experience from all angles.

Your customer experience measurements are influenced by several events, factors, and touchpoints. You need to know when and why people feel a specific way in order to have a full picture.

Customers might, for instance, become irritated with a staggered onboarding process or appreciate your prompt support responses. To provide a detailed picture of the whole experience you offer, you must combine quantitative and qualitative research methods.

  • This information about consumer behavior can be obtained by:
  • Surveys (via email, post-support chat, and pop-up windows on websites)
  • In-person interviews (such as one-on-one conversations, focus groups, and research sessions with incentives)
  • Email-based conversations

In addition to doing direct surveys and interviews, you can find out what clients think of your company by:

  • perusing evaluations
  • Analyzing the behavior of your website
  • Monitoring brand mentions on social media
  • interviewing staff members, such as customer service representatives and sales representatives

Each of these formats can point you in the direction of additional customer journey feedback gathering points (such shipping experiences), allowing you to enhance the process.

How to Determine Customer Experience Accurately

The secret to accurately gauging the customer experience is to use CX measurements. Surveys, retention and churn rates, and customer trend data can all be used to gauge how satisfied your customers are at each stage of the process and if they’ll recommend your business to others or return later.

Initiate customer experience monitoring so you can implement the business changes required to increase revenue and client retention.

GET IN TOUCH

Dgazelle can help you differentiate yourself from the competition by facilitating more engaging, tailored support conversations that consumers will value. 

Subscribe To Our Newsletter

Get updates and learn from the best

Share This Post

Do you want more Sales & Qualified Leads?

Hey, I’m Sunday Samuel. At Dgazelle our core focus is to help individuals and business owners grow thier business predictably & profitably. My only question is, will it be yours?

About Dgazelle

We are a full service Digital marketing, Tech & Ai Solutions Company that is registered in Nigeria and the United States. Our story originates from our experience in advertising, marketing, technology and design. Our work is inspired by art, passion, and one simple principle – To consistently deliver excellence to every individual or business we serve

More To Explore

Uncategorized

Hidden User Behavior: How Heatmapping Reveals What Your Visitors Aren’t Telling You

Ever wondered why some visitors leave your website without taking action? Heatmaps help you track audience behavior, showing where users click, how far they scroll, and what grabs their attention. This data helps you optimize your site’s layout, reduce friction, and make CTAs more effective. A website heatmap visually represents user interactions using color-coded data. Warm colors (red, orange, yellow) highlight areas that get the most engagement, while cool colors (blue, green) show less popular spots. Heatmaps track: Marketers and business owners use heatmaps to enhance user experience (UX), fix engagement gaps, and boost conversions. For example, a well-placed CTA informed by heatmap insights can significantly improve your sales and lead generation. Types of Website Heatmaps Not all website visitors behave the way you expect. Some never scroll past the first section, while others click on elements that aren’t even clickable. Heatmaps uncover these hidden user behaviors, helping you optimize your website for better engagement and conversions. Below are the most valuable types of heatmaps and how they can improve your site’s performance: 1. Movement Maps (Hover Maps): Movement maps track where users move their mouse when navigating your website. This data often correlates with where they are looking, revealing areas of interest. If users’ cursors hover over certain sections for extended periods, they may be paying attention to those areas. 2. Click Maps: Click maps show where visitors click on a webpage, using warm colors to indicate popular areas and cool colors for areas with little to no interaction. If users are clicking on non-clickable elements, it signals confusion and potential UI/UX issues. 3. Scroll Maps: Scroll maps track how far users scroll down a page, helping you understand whether visitors see your most important content. Warmer colors indicate sections with higher visibility, while cooler areas show where visitors drop off. 4. Eye-Tracking Maps: Unlike movement maps, which track mouse movements, eye-tracking heatmaps measure where users’ eyes focus on a page. They provide insight into what catches users’ attention the most. 5. Engagement Zone Maps: Engagement zone maps combine multiple data points, including clicks, scrolls, and movement, into a single visual representation. They highlight areas of high engagement, helping you refine page layout and content strategy. 6. Rage Click Maps: Rage click maps highlight areas where users repeatedly click in frustration. This often signals broken links, slow-loading pages, or confusing design elements. 7. Mobile vs. Desktop Heatmaps: With Nigeria’s growing mobile-first audience, device-specific heatmaps are essential. They show how user behavior differs between desktop and mobile, helping you optimize accordingly. Need expert help optimizing your website for better conversions? Dgazelle can transform your site into a high-performing sales engine. Let’s talk! How Can You Use Heatmaps for Digital Marketing? Heatmaps provide deeper insights into user behavior than standard analytics tools. Instead of just knowing that a page has a high bounce rate, heatmaps explain why—showing whether users aren’t scrolling far enough, missing key CTAs, or getting distracted by unimportant elements. This qualitative data helps businesses refine their website strategy, improve conversions, and deliver better user experiences. Here’s how you can use heatmaps to elevate your digital marketing efforts: 1. Run Cross-Device Analysis Visitors interact differently depending on whether they’re using a smartphone, tablet, or desktop. Mobile users tend to scroll further, while desktop users focus more on above-the-fold content. If your website isn’t optimized for these behaviors, you could be losing potential customers. How to Use This Insight: Optimize CTA Placement – If mobile users scroll more, position key CTAs further down the page. If desktop users engage less with scrolling, place them higher.Ensure Mobile-Friendly Layouts – If mobile users struggle to engage, optimize spacing, font sizes, and button placements.Adjust Image & Content Positioning – Keep critical information in high-visibility areas based on engagement patterns. 2. Improve CTA Conversion Rates Every business wants more clicks on their Call-to-Action (CTA) buttons, but not all CTAs get attention. Heatmaps show where users are actually clicking, helping you refine button placement, size, and design for higher engagement. How to Use This Insight: Identify Click Patterns – If users are clicking elsewhere instead of your CTA, reposition it in a high-engagement area.Eliminate Distractions – Remove elements that compete for attention, such as unnecessary links or images.Test CTA Design & Wording – Experiment with different colors, sizes, and text to find the best-performing version. Example: A click map reveals that users expect a text headline to be clickable instead of the CTA button below it. Making the headline clickable improves engagement. 3. Review Page-Specific Performance Not all pages need heatmaps—focus on high-impact pages that directly affect your business goals. Where to Use Heatmaps Effectively: How to Use This Insight: Track Engagement on Key Sections – Identify where users drop off and tweak content placement.Find the Best CTA Spot – If users scroll past the CTA without clicking, reposition it for better visibility.Refine Content Layout – Move the most important details higher on the page for quicker access. Example: A heatmap on a high-traffic blog post shows that users stop reading halfway. Adding an engaging subheading or CTA in that section encourages them to keep scrolling. 4. Optimize Page Layout to Reduce Bounce Rate A well-structured page keeps visitors engaged. If heatmaps reveal that users aren’t scrolling far enough or aren’t clicking important elements, it’s time for a redesign. How to Use This Insight: Move Essential Elements Higher – Ensure CTAs, product highlights, or lead forms appear in high-traffic areas.Remove Unnecessary Distractions – If users repeatedly click on non-clickable images, replace them with actionable elements.Adjust Content Order – If visitors don’t reach key sections, reposition them to appear earlier in the layout. Example: A scroll map shows that only 20% of visitors reach the pricing section. Moving it closer to the top increases conversions. Unlock the secrets of user behavior—use heatmaps to refine your website and drive more conversions! Heatmap Tool Options: Finding the Right Fit To track and analyze visitor behavior effectively, you’ll need a heatmap or behavioral analytics tool. These tools help

Uncategorized

AI Sets Your Bids, You Count the Sales: Smart Bidding for Nigerian SMEs

Google Ads Smart Bidding transforms the time-consuming and unpredictable nature of manual bidding by leveraging AI technology to automate real-time bid adjustments, eliminating the guesswork of traditional campaign management while analyzing extensive data points including user behavior, device type, time of day, and past interactions to optimize ad spend and maximize conversions—a significant improvement for advertisers who have struggled with the inefficiencies of manually tweaking bids and monitoring performance to stretch their marketing budgets. For instance, let’s say you own an e-commerce store selling sneakers. With manual bidding, you might set a fixed bid of ₦800 for the keyword “running shoes in Lagos.” But Smart Bidding might automatically raise your bid to ₦1,200 at 7 PM when data suggests more buyers are actively searching, increasing your chances of making a sale. Whether you run a small business or a fast-growing startup, leveraging AI-driven bidding can help you scale your ads more efficiently—and that’s where Dgazelle comes in. We not only help businesses optimize their digital ads but also ensure their websites are designed to convert traffic into paying customers. Because what’s the point of driving clicks if your website isn’t built to convert? How Smart Bidding Works Google Smart Bidding takes the guesswork out of bid management by using AI to analyze vast amounts of data and optimize bids in real-time. Instead of manually adjusting your bids, the system evaluates multiple factors to determine the most effective bid for every auction. This ensures you’re always bidding strategically, maximizing your ad spend without constant monitoring. Here’s how Smart Bidding fine-tunes your bids: By leveraging these real-time signals, Google Ads ensures your campaigns remain adaptive and data-driven, optimizing every naira you invest. Competitive Advantage of Smart Bidding? Google Ads Smart Bidding is a game-changer for Nigerian business owners looking to improve their return on investment (ROI) and reduce manual ad management. Whether you’re running an e-commerce store, a service-based business, or a local brand, Smart Bidding helps maximize your advertising efforts with AI-powered precision. Here’s why it’s worth considering: 1. Optimized Bid Adjustments With Smart Bidding, bid optimization happens in real-time, ensuring that your ads reach the right audience at the right moment. The AI evaluates user behavior, search intent, device type, location, and even the time of day, making automatic adjustments to increase your chances of conversion. 2. Improved ROI Smart Bidding doesn’t just spend—it invests every naira where it matters most. Brands that use automated bidding have seen drastic improvements. For example, OLX experienced an 89% increase in conversions while cutting cost per conversion by 32%. That’s the kind of efficiency that translates into more leads and higher sales for your business. 3. Time Savings Manually tweaking bids can be exhausting. Smart Bidding automates the entire process, freeing you up to focus on strategy, content, and customer experience. If you’re running multiple campaigns, automation ensures your ads are performing at their best without constant monitoring. 4. Customizable to Your Business Goals Whether you’re aiming to maximize conversions, achieve a specific cost per acquisition (CPA), or optimize return on ad spend (ROAS), Smart Bidding aligns with your objectives. You set the goal, and Google’s machine learning takes care of the rest. 5. Proven Results Across Industries Businesses across different sectors are already benefiting from Smart Bidding. For example, Goibibo reported a 25% increase in hotel transactions and a 22% lower cost per conversion after making the switch. These results show that when implemented correctly, Smart Bidding is a powerful tool for driving growth. Smart Bidding is just one piece of the puzzle—your website needs to be optimized to convert the traffic you bring in. At Dgazelle, we help businesses build high-converting websites that turn ad clicks into real customers. Let’s optimize your online presence today—contact us to get started! How to Get Started with Smart Bidding Smart Bidding may seem advanced, but getting started is easier than you think. With the right setup, you can automate your Google Ads campaigns and let AI handle bid adjustments while you focus on growing your business. Follow these four steps to integrate Smart Bidding into your marketing strategy. Step 1: Set Up Your Google Ads Account Before enabling Smart Bidding, ensure your Google Ads account is properly configured. Here’s what you need to do: The more accurate and structured your data, the better your results will be. Step 2: Choose the Right Bidding Strategy Your bidding strategy should align with your business objectives. Here are the four main Smart Bidding strategies: To enable Smart Bidding, navigate to your campaign settings, click on “Bidding,” then choose “Change bid strategy” and select the one that fits your goals. Step 3: Run an A/B Test to Validate Your Strategy Before fully committing, it’s wise to test Smart Bidding against your current approach. Follow these steps: Testing allows you to fine-tune your strategy before fully switching over. Step 4: Monitor and Optimize Your Campaign Performance Once Smart Bidding is live, keep an eye on its performance. Use Google’s Bid Strategy Report to track key metrics like: To access your bid strategy performance, go to “Tools & Settings” > “Shared Library” > “Bid Strategies” in Google Ads. Smart Bidding typically improves over time as it gathers more data, so allow a few weeks before making major adjustments. Conclusion AI can analyze vast amounts of data and optimize bids in real-time, but it lacks the strategic insight needed to make informed business decisions. It doesn’t understand your brand voice, long-term objectives, or the unique nuances of your market. That’s where human oversight comes in. By combining AI’s efficiency with your strategic thinking, you can fine-tune PPC ad copy, refine targeting, and adjust campaigns based on real-world insights. Let Smart Bidding handle the numbers, but use your expertise to steer the strategy. The best results come from blending automation with human judgment. Let AI handle the bids while you focus on growing your business. Optimize your ad strategy with expert-backed automation. Get started with Dgazelle today!

Uncategorized

The SEO Blindspot Costing Nigerian Businesses Millions: Zero Click Searches

The way people search online is changing, and Nigerian businesses that rely on SEO to drive traffic and sales may be losing out—without even realizing it. The culprit? Zero click searches. Every day, millions of Nigerians turn to Google for answers. But instead of clicking on a website, they get their answers directly on the search engine results page (SERP) and move on. No website visits. No conversions. No sales. If your business depends on organic search traffic, this trend could be silently costing you leads and revenue. But the good news? With the right SEO strategy, you can turn zero click searches into an opportunity rather than a loss. What Are Zero Click Searches? Zero click searches happen when users find the information they need directly on Google’s SERP without clicking on any website. For example, if someone searches for today’s exchange rate or “best phones under ₦100,000,” Google might display the result instantly—pulling data from third-party sources. You’ve likely done this yourself when checking football scores, flight statuses, or definitions. While zero click searches improve user experience, they reduce website traffic—which means fewer potential customers, less ad revenue, and missed sales opportunities. And with 62.41% of searches now ending with zero clicks (up from 54.11% in 2017), businesses need to adapt fast. The big question is: How do you stop losing traffic to zero click searches—and turn them in your favor? But first why is it happening Why Zero Click Searches Are Growing Zero click searches aren’t just a passing trend—they’re becoming the new normal, and businesses that rely on organic traffic need to take action. A study by SparkToro’s Rand Fishkin, using Datos’s clickstream analysis, revealed that 58.5% of U.S. searches and 59.7% of European searches resulted in zero clicks. The same pattern is growing in Nigeria as search engines evolve. So, why are clicks declining? 1. Google’s Own Features Are Taking Over Google now answers most searches directly on the results page with AI Overviews, featured snippets, and knowledge panels. Instead of clicking on a website, users get instant responses—costing businesses valuable traffic. Beyond that, Google is sending more traffic to its own platforms, like: 2. People Are Searching Beyond Google Websites aren’t just competing with Google anymore. Consumers are finding content on: How Nigerian Businesses Can Win in the Age of Zero Click Searches How users find answers directly on search engine results pages (SERPs) without clicking through to a website—are changing the SEO procedure. Businesses must adapt by focusing on structured data, local search, and multi-platform visibility to maintain traffic and brand awareness. Zero click searches aren’t going away, but the right SEO strategy ensures your business still gets noticed and converts visitors into customers. Need an SEO strategy tailored to your business? Let’s talk! 1. Implement Schema Markup Schema markup is structured data that helps search engines and AI-driven models understand and display your content effectively. By implementing the right schema types, you improve your chances of appearing in zero click search results like featured snippets and product listings. Here are key schema types to prioritize: Using schema markup increases the likelihood of Google recognizing and surfacing your content in prominent SERP positions. 2. Strengthen Local SEO For businesses with a physical presence or service area, optimizing for local search is crucial. Local SEO strategies help brands appear in search features such as map packs, knowledge panels, and local featured snippets. Here are key actions to improve local search visibility: By focusing on local SEO, businesses can improve their chances of being featured in high-visibility SERP positions for location-based searches. 3. Track and Adjust Your SEO Strategy To measure the effectiveness of your zero click search strategy, continuous monitoring is essential. Rank tracking tools provide insights into performance, showing whether content adjustments are needed. Using a tool like Ubersuggest’s Rank Tracking, businesses can: If rankings decline or stagnate, revisiting content strategies—such as improving clarity, updating information, or adding structured data—can help regain visibility. 4. Expand Beyond Google with Search Everywhere Optimization Search behavior is evolving, with users increasingly seeking answers on multiple platforms beyond traditional search engines. To maintain visibility, businesses must optimize for different channels, including: By diversifying search presence, businesses can reach audiences across multiple platforms, reducing dependence on traditional organic search traffic. Conclusion: Future-Proof Your SEO with Smart Strategies As zero click searches continue to grow, businesses must embrace a multi-faceted SEO approach. Implementing structured data, optimizing for local search, tracking performance, and expanding search visibility across platforms will ensure continued success in an evolving digital world. By adapting to these changes now, businesses can maintain relevance, increase brand awareness, and drive meaningful engagement despite the shift in search behavior. Ready to drive more organic traffic? Dgazelle’s proven SEO strategies will improve your rankings and boost conversions. Let’s elevate your website today

Do You Want To Boost Your Business?

drop us a line and keep in touch